When do we market Kansas crops?
Author
Published
1/12/2024
The first step in marketing should always be to develop a plan, which I like to define as a proactive strategy to price your crop before, at and/or after harvest. A marketing plan should consider your financial goals, cash flow, storage capacity, crop insurance, labor, anticipated production, appetite for risk and price outlook, with an overarching objective of managing your price risk throughout.
The fact that it considers many factors specific to each farm and farmer, means each marketing plan will be unique.
The marketing plan should consider action before, at and/or after harvest, therefore encompassing a relatively long period of decision making (two years or more). But how much crop should you price before, at and after harvest? Clearly, it depends on your marketing plan and price outlook, but what does the average Kansas farmer do in an average year? As I’ve conducted marketing education over the last several years, I’ve often posed that question but really haven’t gotten an answer I can quantify. So that’s the topic for today. How much corn and soybeans do Kansas farmers sell before, during and after harvest?
From a price risk management perspective, this is important because during the preharvest phase, farmers have access to Revenue Protection, a crop insurance policy that provides both production and price risk protection, and in Kansas, more than 90 percent of acres are covered under a Revenue Protection policy. But for any crop held after harvest, farmers must turn to other marketing tools, or simply bear the risk of price declines, along with the associated costs of storing their crop. Farm Bureau has a significant amount of policy devoted to both risk management, including policies #220, Basis Areas and Transportation; #221, Commodity Futures and Options; #222, Federal Marketing and Bargaining Legislation; #223, Federal Marketing Orders; #224 Marketing Philosophy; and #225, Risk Management/Crop Insurance.
To answer the question, how much corn and soybeans do Kansas farmers sell before, at and after harvest, I focus on two sets of data from the Natioal Agricultural Statistics Service (NASS). The percentage of crop marketings that remain on Dec. 1, and crop stocks stored on farm, as of Dec. 1. While neither fully answers the question, together, several inferences can be made.
Percentage of crop marketings that remain on Dec. 1
Each year, NASS publishes information on the percentage of crops sold each month as part of their Prices Received Survey of commodity buyers/first purchasers. The survey1 collects price and quantity information and at crop year end, are used to calculate the percentage of the crop purchased (marketed) each month, along with a weighted average monthly price. A weighted average crop year price is also calculated from this data and used in national balance sheet tables and for farm bill programs such as the Agricultural Risk Coverage (ARC) Program. The percentage of crop marketings remaining on Dec. 1 is simply the total of percentages marketed in September, October and November subtracted from one, providing an estimate of necessary post harvest marketings. It does not provide information regarding where the crop is located, for example on farm or in an elevator, feedyard or processing facility.
Dec. 1 stocks On Farm
This data comes from the Dec. 1 Agricultural Survey of farmers, asking both what their total storage capacity is, and how many bushels were on hand or stored on the farm. Because this is after harvest, any marketing related to these bushels are clearly part of a farmers post harvest plan, but it does not provide an indication of how many bushels will be fed on farm to livestock.
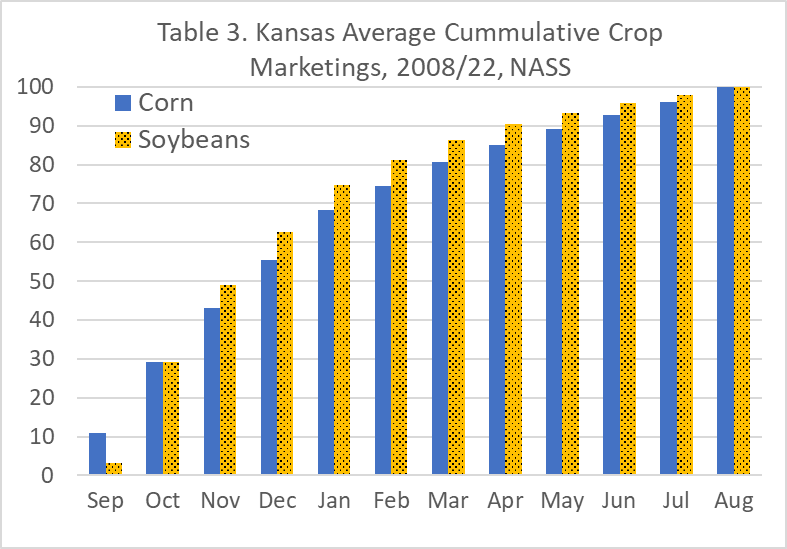
Tables 1 and 2 depict monthly Kansas marketing of soybeans and corn respectively. Clearly, the majority of both crops are marketed in the first five months of the marketing year. For example, cumulative marketings through January of each year are 68.3 percent and 74.9 percent, respectively, for corn and soybeans over the last 15 years.
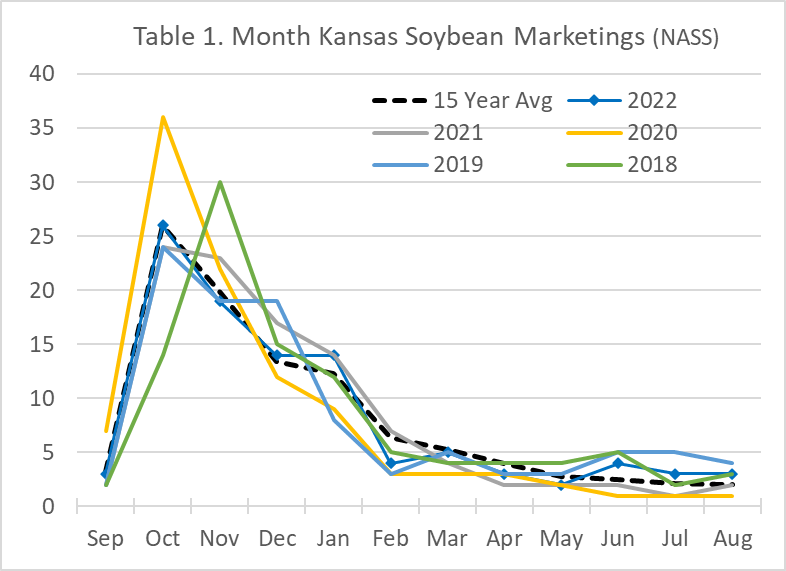
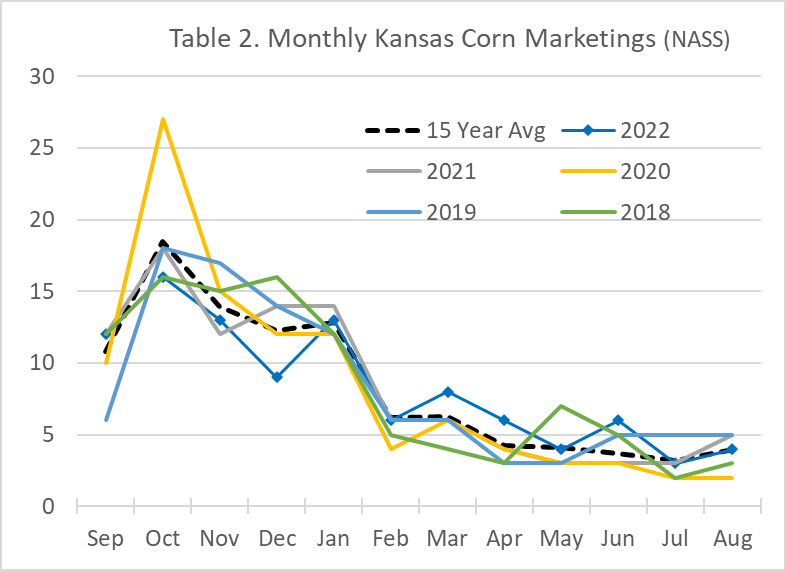
With total harvest nearly complete by the end of November, but with a significant percentage still cut in November, 13.4 percent, corn, and 24.6 percent, soybeans (five-year average, NASS), we assume any marketings in the September-November period to represent either “harvest time” sales or deliveries of previously forward contracted crop. With the percentage of marketing from December to August, representing postharvest marketings.
Tables 4 and 5 depict this data, along with the percentage of production stored on farm, Dec. 1, for each of the last 15 crop marketing years.
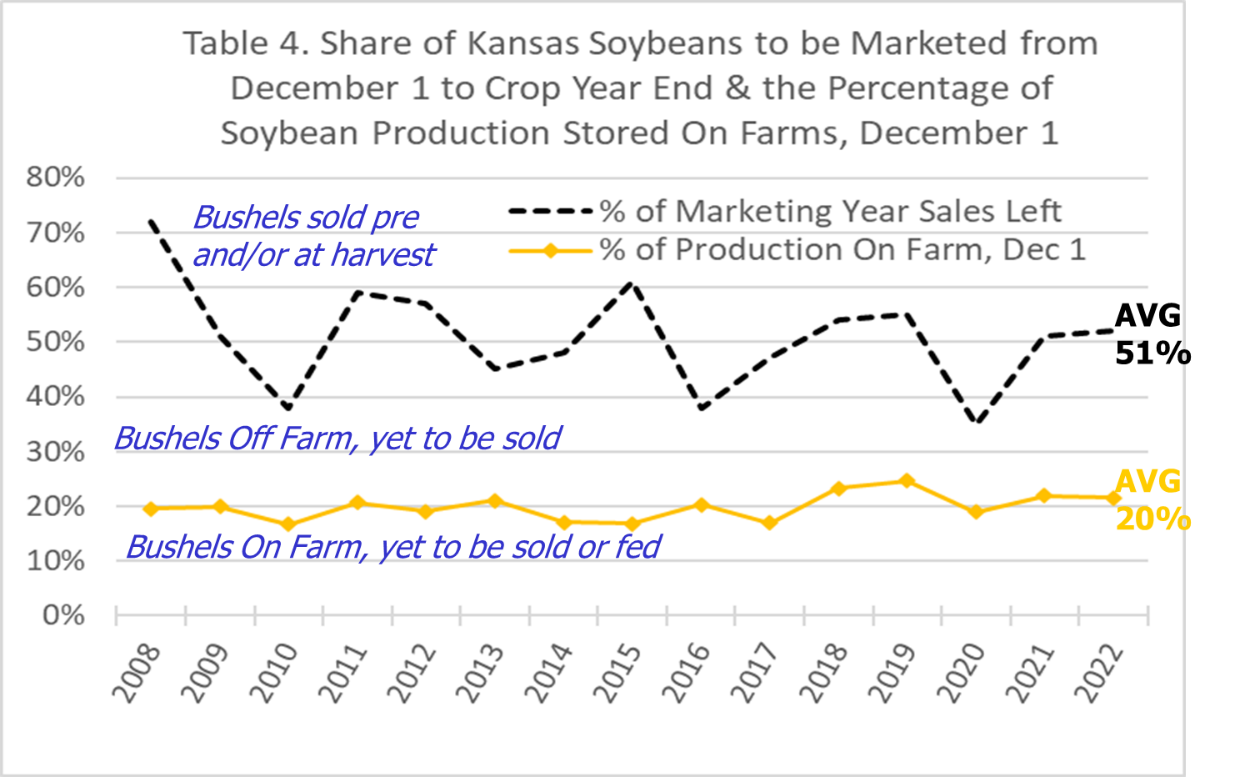
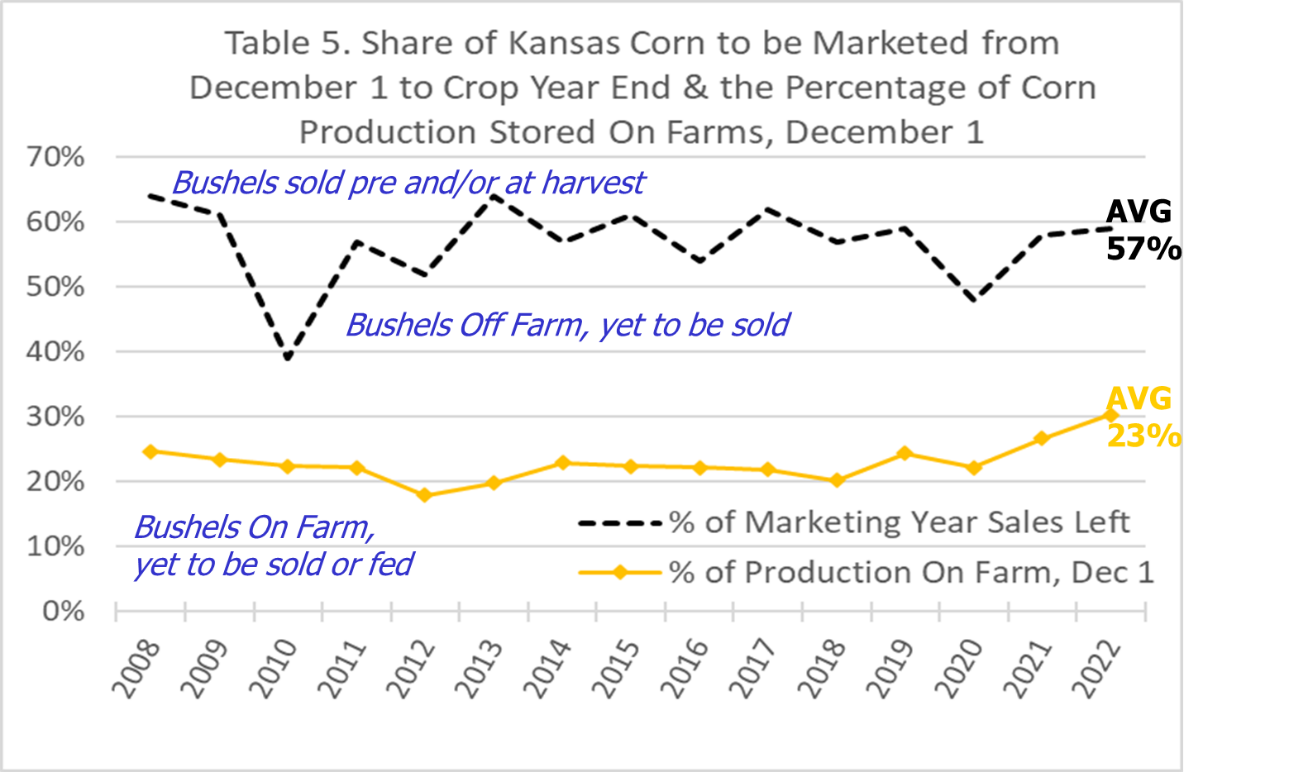
From this data, we can begin to infer how much corn and soybeans Kansas farmers sell before, at and after harvest. Noting that because we have no direct estimates of how much on farm stored crops will be used as feed, and thus not included in the NASS “Marketings” data, these are only inferences. On average, Kansas farmers:
Market 43 percent of their corn, and 49 percent of their soybeans, either before or at harvest, and while it was previously noted that revenue protection policies can assist in managing preharvest price risk, it can also be argued markets often provide opportunities for farmers to price their crops before harvest at levels greater than those occuring at harvest. Because of this a preharvest marketing plan and a willingness to consider various preharvest marketing tools can increase farm income.
Market 57 percent of their corn, and 51 percent of their soybeans, after harvest. And as noted earlier, for any crop held after harvest, farmers must turn to other marketing tools, or simply bear the risk of price declines, along with the associated costs of storing their crop. Making post harvest marketing plans and a willingness to consider various preharvest marketing tools vital to their farm’s success.
Store 34 percent of their corn, and 31 percent of their soybeans off farm in elevators, processing plants, feedyards, etc., holding it for sale postharvest. In general, off-farm grain storage costs involve both a monthly storage fee and the interest expense associated with the value of the crop. Monthly elevator storage costs will run anywhere from six to seven cents per bushel.
Store 23 percent of their corn, and 20 percent of their soybeans on farm. Noting again that there are no direct estimates of how much on farm stored crops are ultimately fed to livestock on farm.